Firewall Status Display - MS Final Practicum Project
Firewall Status Display
 For my Cybersecurity MS Practicum Project (CS6747) at The Georgia Institute of Technology.
Author: Zeb Rasco.
Date: 11/22/2022
For my Cybersecurity MS Practicum Project (CS6747) at The Georgia Institute of Technology.
Author: Zeb Rasco.
Date: 11/22/2022
Background
Home routers are a prevalent part of today’s internet ecosystem. Home internet packages from ISPs typically include a router or a router/modem combination. A typical home user will have multiple devices which need internet access, such as smart TVs, phones, tablets, computers, and various Internet of Things (IoT) devices such as cameras and smart appliances. A router is required for multiple devices to connect to a single internet connection, and virtually all modern routers also include a wireless access point for wireless devices. This technology direction has resulted in the exposure of many routers as public IP addresses, which serve as the bridge between a private home network and the public internet.
IoT devices are also prevalent today, with an estimated 11.28 billion devices in 2021, and are projected to almost triple to 29.42 billion devices by 2030 (Vailshery, IOT connected devices worldwide 2019-2030 2022). In addition, IoT devices often run on proprietary embedded systems and may have vulnerabilities that are difficult to patch, if a patch is even available at all (Zou, IOT devices are hard to patch: Here’s why-and how to deal with security 2022).
 Fig. 1 - Projected growth of IoT devices over the next 10 years (Vailshery, 2022).
Because of this threat, stock router firmware typically includes a firewall. While these built-in firewalls provide adequate protection for many use cases, attacks continue to become more sophisticated. Devices continue to become infected with various types of malware, giving the attacker access to, or even control of, the home network.
Problem statement
Firewalls bundled with home routers are often proprietary and lack a consistent interface or reporting/features. While many protect against common attacks, often, the user is unaware of the overall threat environment. There is a separate learning curve with each device, which reduces the consistency of users, in general, to be aware of a targeted attack from a determined adversary.
To get around this, users sometimes install custom firmware on their existing routers (Hoffman, 2014). Examples include DD-WRT, OpenWRT, and Tomato. It involves replacing the stock firmware with a more feature-rich firmware, typically including high-end features such as SSH access, an enhanced web interface, VPN, and other value-adds. They’re also bundled with a firewall which can be managed with the iptables command line tool, making it highly customizable. However, while this provides enhanced protection, it does not solve the lack of insight into threats. The user can typically only use a command to view raw firewall data in the form of Linux-style syslog entries via the dmesg shell command.
To deal with this shortcoming, such a user can install orchestration or logging software which gives greater threat insights, at the cost of substantial infrastructure investment, as we will explore in-depth later. There is also a significant degree of setup and customization, which can take hours or days. These solutions typically also require maintenance in the form of Virtual/Physical Machine resource management, operating system updates, application updates, further customization, incompatibilities with newer updated libraries, and so forth. These updates sometimes also fail, which in turn increases the technical burden demand on the user.
One alternative approach is investing in a Small Form Factor device with a purpose-built OS and software suite/IPS installed, such as the well-known IPFire. However, this has an obvious infrastructure cost as the base system (with hardware-supported AES encryption for the WiFi network, etc) and multiple network ports can easily run 200 to 300 USD. While such a solution is effective, it requires an infrastructure cost many users can’t afford.
So, there is a problem (and niche) for users who find themselves in this situation and can’t set up a fully orchestrated solution. This demographic of users need to gain insight into network attacks. Still, it needs to do so with relative ease until they find themselves in a position to implement a more comprehensive orchestration framework.
 Fig. 2 - Example SFF firewall device (Vnopn Micro Firewall Appliance) with WiFi antennas. Current cost is 262 USD.
Solution
Considering the relatively demanding requirements of the solutions above, my proposed solution for this niche problem is an app with the working title of Firewall Status Display (built on my previous work). This app is designed to quickly provide valuable insights into router firewall activity, with minimal setup and infrastructure requirements. It runs on Windows 10, which has over a 71% market share of all desktop systems (Desktop windows version market share worldwide 2022).
Architecture and implementation details
I wrote my application using Visual Studio 2022 Community Edition with the .NET 6 SDK. It also uses Progress Telerik for WPF UI controls. It uses a standard MVVM design pattern and dependency injection to share services amongst program components without needing static dependencies. I aim to implement programming best practices to ensure reliability and consistency.
The program runs as an application on standard Windows desktop systems and listens for firewall data on UDP port 514. These firewall UDP datagrams are generated from a remote syslog daemon on a Linux machine or custom firmware on a router. These datagrams are commonly used iptables log output entries, typically output to the system log on these devices, and can be optionally redirected to a remote server, in this case, the machine running the firewall status display.
Design goals & pre-requisites
The design goals of my solution are straightforward: 1) Easy and quick setup 2) Minimal requirements 3) Minimal configuration 4) Feature-rich insights out-of-the-box
The application is portable by default and can be decompressed and executed. The prerequisites for installation are:
- .NET 6 Runtime
- SQL Server Express (I used 2019, but any should work)
- 150MB disk space
Design goals #1 and #2 are fulfilled with these prerequisites. A user needs only to edit the appsettings.json file in the application directory to point to the database (usually localhost), then run the application and use the Geolocation DB import tool to import a free Geolocation database. Finally, the user enables iptables logging (on by default for DROP rules) and configures their router to output syslog entries to the client machine. These simple steps seek to fulfill design goal #3.
When running the program, the user will see several tabs which seek to fulfill design goal #4. They can see a filterable/sortable table of dropped firewall packets, graphs by country and port, port scans, and general firewall statistics. These statistics include average daily packet counts and show a graph of overall activity over time.
I’ve summarized the features here, but the reader can find a more in-depth tour of the application in Appendix A.
Availability to the general public
The application is open-source and available on my GitHub repository: https://github.com/zrasco/firewallstatusdisplay
My goal is to give a viable security tool back to the community and release the source code to encourage others to add to the functionality. Many others have contributed to my skill development throughout my career, and I’m happy to pay it forward by releasing this application under an open-source license. It is free for personal, educational, research, and commercial purposes (though it uses Progress Telerik, so you may need that license) with no attribution required.
Evaluation
In this section, we’ll evaluate the effectiveness of this solution using three criteria:
- Pt. 1 - Analysis of the firewall data itself
- Pt. 2 - Use with different router firmware & Ubuntu Linux
- Pt. 3 - Requirements and setup compared to other solutions
Pt. 1 - Firewall data
We’ll examine various aspects of the data in more detail and attempt to draw some conclusions about what happened. We are working with approximately 39 days of data from 10/11/22 to 11/24/22. Around 246,000 log entries are averaging 6,304 dropped packets per day.
Traffic by country
Using the geolocation information in the database, we can see where this traffic originates.
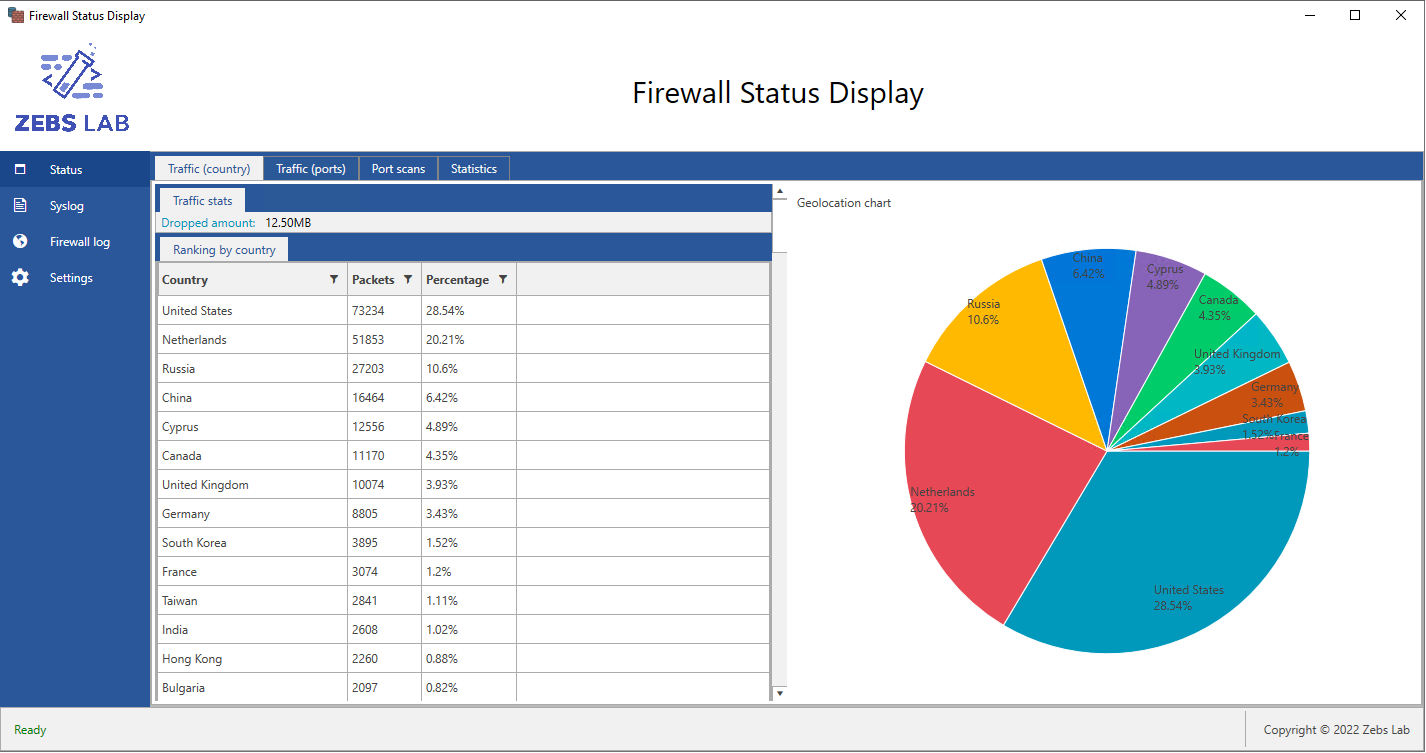
 Fig. 3 - Traffic by country showing relevant data.
Here is the table corresponding to the top 10 origin countries: |Country|Packets|Percentage of traffic| |——-|——-|———————| |USA |73,234 |28.54%| |Netherlands |51,853 |20.21%| |Russia |27,203 |10.6%| |China |16,464 |6.42%| |Cyprus |12,556 |4.89%| |Canada |11,170 |4.35%| |UK |10,074 |3.93%| |Germany |8,805 |3.43%| |South Korea |3,895 |1.52%| |France |3,074 |1.2%|
As we can see from the table, we have the usual suspects: the USA, China, and Russia. Surprisingly, the Netherlands came #2 on this list. I could not find data to explain this, but I suspect part of the reason is due to the large industry of PaaS providers based in this region. In my experience of procuring Virtual Private Server (VPS) slices and cloud-based servers, I discovered a large number of them are based in the Netherlands and surrounding areas.
The value of this data is being able to mitigate swaths of attacks by blocking all traffic originating from a given country. Several online scripts can do this job; they typically involve a series of iptables rules which filter traffic by geographic region, again using publicly available geolocation tables.
Traffic by port
The application provides a similar breakdown of traffic by port, which we will review here.
 Fig. 4 - Traffic by port showing relevant data.
Here is the table of the top 5 ports: |Service Name|Port|Packets|Percentage| |————|—-|——-|———-| |Telnet|23|23280|9.16%| |SSH|22|2750|1.08%| |Http|8080|2746|1.08%| |Personal-agent|5555|2418|0.95%| |SIP|5060|1435|0.56%|
As we can see, telnet continues to be a widespread attack vector well into late 2022. This is likely due to the large amount of misconfigured systems remaining in the wild, such as routers, servers, and any other device which utilizes a control channel using the telnet protocol. Such devices will either have a blank password or a default password (with the device name sometimes conveniently placed in the logon banner).
Also, according to this data, SSH and http (using port 8080, an alternate HTTP port) are common attack vectors. The SSH attempts are likely to probe attempts to identify servers for brute-forcing. At the same time, the http port 8080 connections are possible attempts to log into routers using the remote administration web interface. Such routers can be left unprotected if the user doesn’t correctly configure them, allowing an adversary to gain control of the router through this port.
Notably absent is traffic on http/https (ports 80 and 443, respectively). My ISP, COX Cable, filters all traffic to tcp port 80. I also have a web service on port 443 for an Apache https server, so these do not appear as dropped packets. A significant amount of reconnaissance/attacks were likely attempted on these ports but are not present in this analysis.
Pt. 2 - Different firmware
In this evaluation, I compared my solution against different router firmwares and Ubuntu Linux. Here is a table summarizing the results.
| Firmware | Results | Notes |
|---|---|---|
| OpenWRT | Compatible | Native platform. No issues. |
| DD-WRT | Almost compatible | Works, but BusyBox truncates rsyslog messages to 256 bytes |
| Ubuntu Linux | Compatible | No issues but needed to add RegEx for UFW DROP rule |
Overall, the application proved robust in terms of differing platforms. A few minor issues presented themselves that I addressed quickly. The reader will find a more detailed account of my evaluation in Appendix B.
Pt. 3 - Vs. different solutions
We’ll summarize the comparison of different solutions in the table below. I assigned myself an upper bound of 3 hours for each solution evaluated.
| Solution | CPU cores | RAM | Disk space | Setup time |
|---|---|---|---|---|
| Firewall Status Display | 1 | Runs in OS | 10GB (w/SQL server) | <30 minutes |
| Graylog | 2-4 | 4-8GB | Scaling | 11 hours |
| Splunk | 32 | 128GB | Scaling | 3+ hours |
| Alienvault OSSIM | 2 | 4-8GB | 50GB | 3+ hours |
Of all three solutions, Splunk proved the most capable. Graylog comes second, but unlike Splunk, no out-of-the-box log parser was available for syslog-style iptables log entries. Such a parser may be downloadable (or can be created), but I was unable to find it, and creating one would go well beyond the evaluation constraints. As for AlienVault OSSIM, either it doesn’t support this type of reporting environment at all or would do so only after heavy customization, which would include custom log ingestion, creation of data adapters, creation of visualization dashboards, custom geolocation integration, and so forth.
Finally, the infrastructure requirements for all three comparable solutions involve provisioning a separate VM of varying configurations, which requires more time (sometimes setting up an OS) and requires more infrastructure than my project, which will install on a Windows 10 machine in a matter of minutes and work out-of-the-box. Thus, based on this evaluation, my application fulfills the needs/goals set out in the design, specifically to provide a feature-rich firewall reporting solution with minimal effort compared to other solutions.
The reader can find technical details on the solution comparison evaluation in Appendix C.
Limitations
Limitations of the solution are obvious, given the time constraints of the project. Additional development work will remediate most of the limitations within the project’s scope.
MS SQL server express size limitations
SQL Server Express itself is a significant limiting factor. With a 10GB database limit, one can expect approximately 15 to 20 days of historical data. For my evaluation, I used SQL Server Developer Edition instead, which has no limit. So SQL Server Developer Edition is a possible way around this limitation (until MySQL support is added in a future release), depending on the use case.
Minimal ad-hoc reporting
This limitation is due to the time constraint. The application produces a few reports, such as traffic by country/port and port scans. However, there is no generalized reporting function. Future iterations may have this capability, and even sooner, an ability to export firewall data to CSV format for use in applications such as Microsoft Excel.
No cross-platform support
The program is only verified to work in Windows 10, although I’m virtually sure it will work in Windows 11. Because it is a Windows Presentation Foundation (WPF) application, it needs much re-work for cross-platform support. However, this app may still run in a Windows API framework such as Wine, though I haven’t tested this.
Scope is limited to firewall data only (by design)
I designed this program to fulfill a niche. It displays firewall data, attempts to give insights, and alerts the user of potential historical/ongoing attacks. It’s not a comprehensive security solution but rather works in tandem with other approaches or, at the very least, serves as a stop-gap measure until the user can implement a broader-scope security solution down the road. I designed this program with this scope and these constraints in mind.
In addition, the system is not an IDS or an IPS (such as IPFire). The firewall program only displays dropped packets, which indicates the firewall thwarted those attacks. Future iterations of this solution will likely include support for allowed packets for a more comprehensive look into active sessions.
Finally, one can only view the program’s data and therefore offers no remediation for an ongoing attack. It is incumbent upon the user to take appropriate action to mitigate the threat. I expect the target demographic using this application to have the skills necessary to stop an attack, or at the very least, the willingness to unplug their network cable in an emergency!
Future work
We’ll now discuss future work which is potentially valuable. Not only have there been many good suggestions from my colleagues, but I needed more time to implement many more of my own ideas. This program still has potential for further development; this version is just an example of what’s possible.
Support for multiple RDBMS
Currently, the program supports Microsoft SQL Server, which can be free in some instances (SQL express w/10GB database size limit, SQL Server Developer Edition) but may not be appropriate for all users. Thus there is a need to expand database support for other relational database alternatives such as MySQL.
Further UI integration & enhancements
The UI has basic functionality but could have some enhancements:
- Copying data from the tables
- Exporting to CSV, PDF, or other formats
- Enhanced UI integration such as context menus, right-clicking for focused views, etc
- Graphs need cleaning up
- Auto-start with Windows feature
- MSI installation package
Database-less option
The original design did not have a database table for the Geolocation entries; I added it to mitigate the problem of rate limits from free Geolocation web APIs. Working with these rate-limited APIs would have involved additional programming complexity, such as queues and timers. Such an approach is still feasible. However, I de-prioritized it as there was limited time to develop the application. That said, there is still a valid use case for a database-less option, as the entire purpose is to avoid installing heavy back-end infrastructure.
The limitations of such an approach are possible delays in retrieving Geolocation data and only having a non-persistent store of firewall log data. Still, these tradeoffs are likely acceptable to many users.
More dashboards & alerts
The current dashboards showcase basic functionality and could be more flexible. For example, adding filters to the dashboards is possible to allow a finer-grained look into the data. In addition, it’s possible to customize the graphs to enable different axes of data or periods to be displayed. Finally, it does not have a general-purpose ad-hoc report module. Such a module would allow users to create charts and reports, save templates, and so on. Therefore there is much development potential in this area of the application.
Alerts are another improvement opportunity. While I intended to include more than 1 type of alert (currently port scans), time ran short; thus, port scan alerts are the only type available. Furthermore, this type of alert is minimally customizable (changeable in appsettings.json). A future alert management module would allow users to abstract data flows that trigger such alerts. Parameters such as types of packets, frequency of packets, size, and so on can be input as parameters into this module. A user could create custom alerts suitable for their specific needs.
Hints for IPTables rules based on pertinent traffic
While the program acts as a view-only, the fact that it uses iptables logs also provides the capability of suggesting iptables commands which will further mitigate detected threats. For example, with the geolocation database, there is the potential to automatically generate a script consisting of iptables commands which will block entire countries. Another possible scenario: if patterns of port scans are detected, discard all packets from these IP addresses and any associated Autonomous Systems (ASs). The iptables command-line interface is nearly universal across all platforms that support it, so the program has the potential to suggest helpful commands to the user to strengthen their security posture.
Log allowed & rejected traffic
The implementation presented in this current body of work logs dropped traffic only. This is for several reasons:
- Dropped traffic is typically already logged with minimal customization
- Logging allowed/rejected traffic substantially increases overhead and customization requirements
- Such logging is implementation-specific
Each flavor of the custom firmware, as well as Ubuntu Linux, has optimal mechanisms for logging this type of traffic, and each requires specific customization. However, despite the increased difficulty, the main benefit is that this logging can alert the user of a focused attack. Examples include brute-force attempts, SYN floods, and other similar DoS attacks. Combined with the suggested iptables hints rules mentioned above, this may give even an inexperienced user the ability to stop an ongoing attack.
Further evaluation against other comparable products
This project fulfills a niche, so it has been challenging to find an apples-to-apples product to evaluate. I have made a best-effort attempt to do so. However, my lack of finding an exact product to compare to does not necessarily indicate such a product doesn’t exist. Further research may find similar products, resulting in a more detailed comparison.
Conclusion
We’ll wrap things up with a summary of why this program is helpful, the advantages/disadvantages of using it, and which needs it fulfills.
Other products can fulfill this task. However, none (as of the time of this writing) fulfill this specific niche. I designed this program to do one thing and do it well: report firewall activity for a large body of inexpensive infrastructure already out there. With minimal setup requirements and configuration compared to other solutions, this application satisfies the need for a user to hit the ground with minimal hassle. It reports firewall data as effectively as possible.
Further hardware investment is not typically required, provided the user has a router that can receive custom firmware such as DD-WRT. One need not provision VM infrastructure for virtual appliances. The program is open-source, and any willing person can add features. It runs on Windows 10, which has a high market share of the desktop market and allows desktop integration features such as notifications/alerts. Minimal configuration is required, and the program’s main features work out of the box. The system requirements are modest, requiring only MS SQL Server (with support for other relational databases and a database-less option later), the .NET 6 runtime, and a mere 150MB of disk space.
In summary, this program fits a need for the target audience of intermediate to advanced users who want to monitor their firewall activity inexpensively, quickly, and effectively with minimal headaches. It ultimately aims to fulfill the niche it’s intended to serve, and this work is a promising start and has solid future potential.
References
Hoffman, C. (2014, May 13). How to use a custom firmware on your router and why you might want to. How. Retrieved December 6, 2022, from https://www.howtogeek.com/189073/how-to-use-a-custom-firmware-on-your-router-and-why-you-might-want-to/
Vailshery, L. S. (2022, November 22). IOT connected devices worldwide 2019-2030. Statista. Retrieved November 22, 2022, from https://www.statista.com/statistics/1183457/iot-connected-devices-worldwide/
Zou, X. (2022, August 18). IOT devices are hard to patch: Here’s why-and how to deal with security. TechBeacon. Retrieved November 22, 2022, from https://techbeacon.com/security/iot-devices-are-hard-patch-heres-why-how-deal-security
Desktop windows version market share worldwide. StatCounter Global Stats. (2022, October). Retrieved November 23, 2022, from https://gs.statcounter.com/os-version-market-share/windows/desktop/worldwide
Source code snippets used
Instructions/sources used for evaluation
Alienvault installation instructions: https://cybersecurity.att.com/documentation/usm-appliance/initial-setup/ossim-installation.htm
Graylog installation instructions & links to virtual appliances: https://docs.graylog.org/docs/installing
Spunk OVA for VMWare: https://splunkbase.splunk.com/app/3216
Installation of Splunk on Ubuntu Linux: https://www.bitsioinc.com/install-splunk-ubuntu/
IPtables for Splunk: https://readthedocs.org/projects/iptables-for-splunk/downloads/pdf/latest/
Splunk system requirements (32 CPU cores, 128GB RAM, SSD): https://docs.splunk.com/Documentation/DSP/1.3.1/Admin/Compatibility
Graylog system requirements (4 CPU cores, 8GB RAM, SSD): https://assets-global.website-files.com/5e9fae47f9a5b161fc3f7024/5f37e9b37e418d596937eacb_Graylog%20-%20Graylog%20Enterprise%20Datasheet.pdf
Alienvault OSSIM system requirements (2 CPU cores, 4-8GB RAM, 50GB SSD): https://cybersecurity.att.com/documentation/usm-appliance/initial-setup/ossim-installation.htm
Appendix A - Application feature details
Features
We’ll now review the main features of the application. The application has 4 main areas:
- Status
- Syslog
- Firewall log
- Settings
A user can click the corresponding navigation links on the left-hand side of the application. The relevant sections will then appear on the right. Users can further drill down into areas of interest by using the tab controls embedded in the main layout pane on the right-hand side.
Status dashboard - Traffic by country
Traffic by country is the default view of the program and will group dropped firewall packets by their country of origin. There is a conveniently placed sortable and filterable datagrid to view this information in more detail.
 Fig. 3 - Traffic by country dashboard.
Status dashboard - Traffic by port
This layout is similar to the previous section but shows traffic by port number. It helps identify common attack vectors used by adversaries.
 Fig. a1 - Traffic by port dashboard.
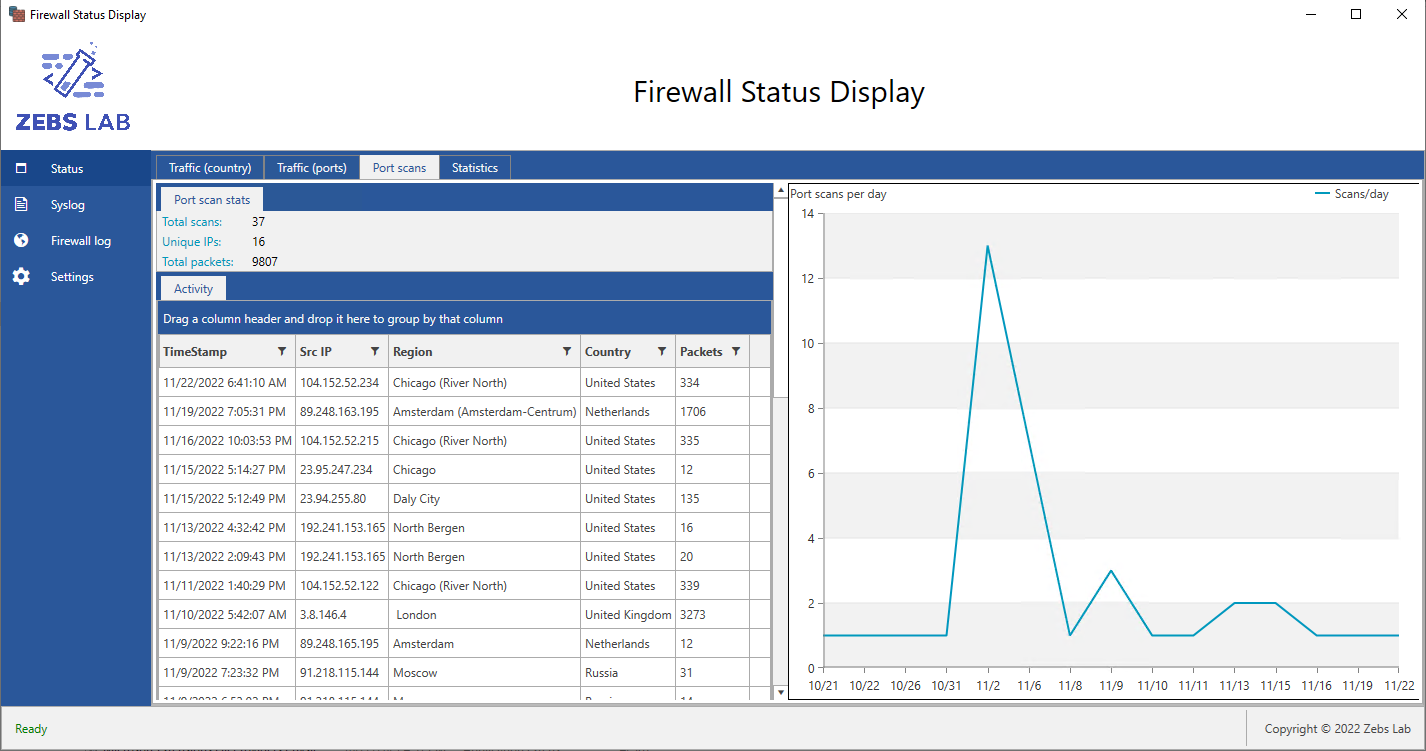
Status dashboard - Port scans
As in the previous two layouts, port scan activity is available in the accompanying data grid. There is also a chart showing trends of port scan activity over time, where spikes may indicate a coordinated attack from a focused adversary instead of a random sweep from an adversary scanning swaths of IP addresses. It logs port scans and notifies the user within one minute.
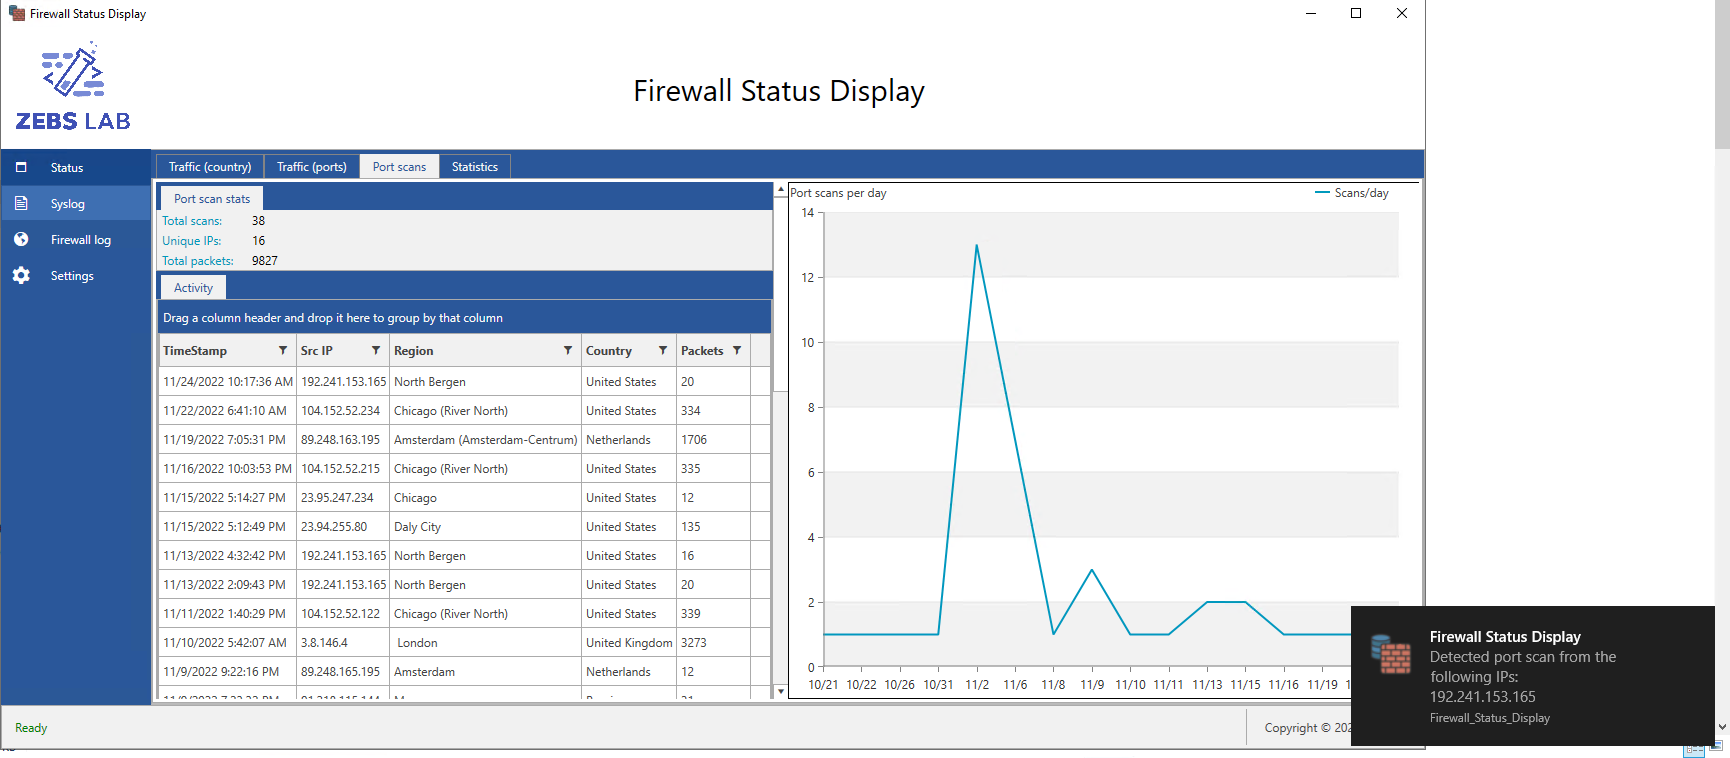 Fig. a2 - Port scan dashboard showing alert of a recent port scan.
Status dashboard - Statistics
This last pane of the status dashboard shows general firewall statistics. IP geolocation information utilizes an LRU cache for fast lookups. As you can see from the output, I have a lot of days worth of data and plan on cleaning this up.
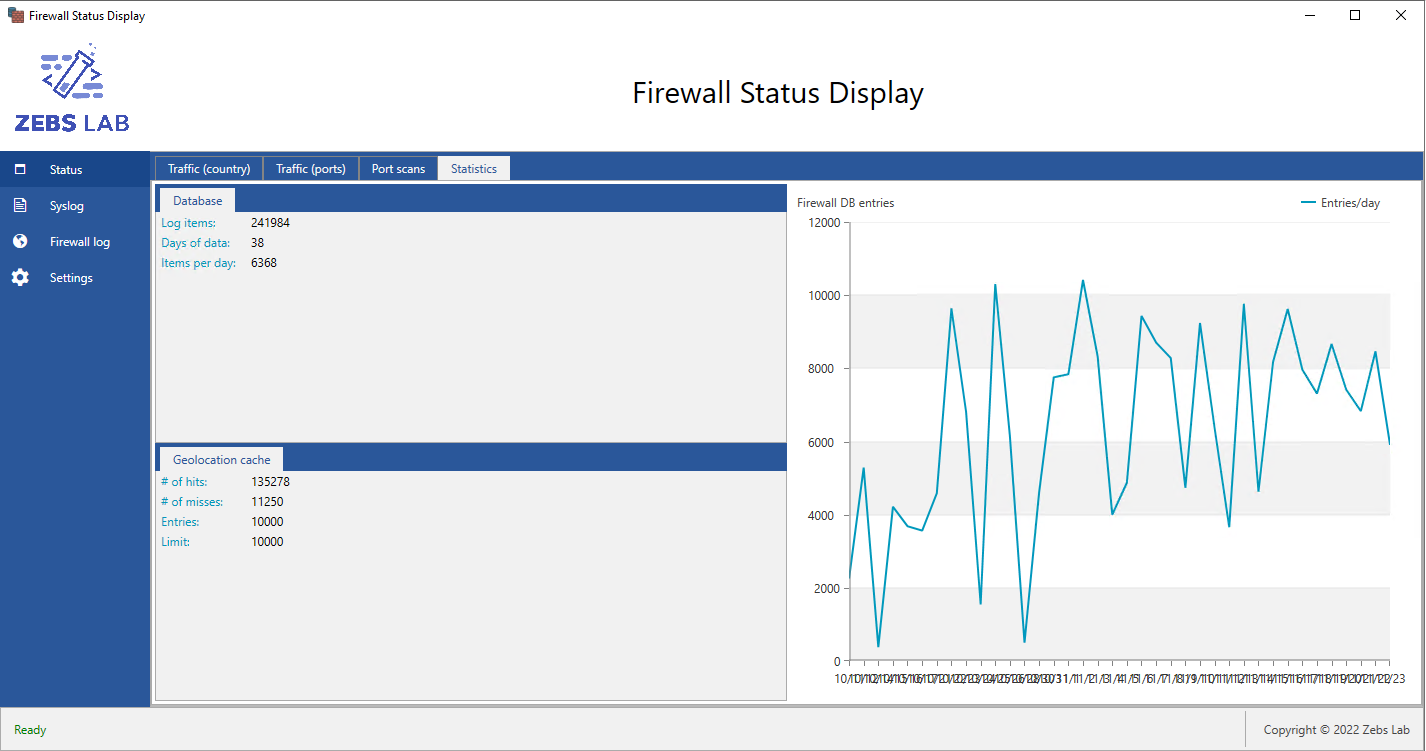 Fig. a3 - Statistics dashboard.
Syslog output
This section of the application shows the raw syslog output. It helps to debug and can also be used to check non-iptables-related logs if needed.
 Fig. a4 - Raw syslog output.
Firewall log
Here we can see the actual firewall log entries arranged in a data grid. This grid allows filtering and sorting, allowing the user to drill down into specific information quickly.
 Fig. a5 - Parsed firewall data.
 Fig. a6 - Parsed firewall data with active filter.
Settings
Finally, in the settings area, we can see the top part of the layout contains application-specific information. The user can see the status/health of the application and take action.
 Fig. a7 - Settings view, database properties.
 Fig. a8 - Settings view, geolocation import feature.
Database tables
Now that we’ve covered the application itself, we’ll take a quick tour of the two database tables used by the application. I’m using SQL Server Management Studio to view the database tables in this overview.
Firewall log entries table
First, we see the table of firewall log entries used in the application. This persistent storage approach allows the application to use the historical data if restarted. The careful reader will notice that the Geolocation entries are not normalized because IP addresses change location over time. However, I am exploring the possibility of adding at least one more table to normalize the database further.
 Fig. a9 - MS SQL Server Management Studio showing firewall entries.
Geolocation table
We find mappings of IP address ranges to geolocation data in the Geolocation table. I chose this instead of a cloud-based web API due to rate limits and other considerations. However, I plan on implementing a database-less approach to this in the future.
 Fig. a10 - MS SQL Server Management Studio showing geolocation entries.
Appendix B - Evaluation vs. different firmware
We’ll now review how well the application performed on three platforms. I will give an overview of my experience and explain what I encountered with each one. Overall, the application proved robust in terms of differing platforms.
OpenWRT
OpenWRT is the native development platform, so I implemented all features of the parser using it.
The setup was straightforward; OpenWRT has the firewall enabled by default with a relatively strict filtering policy. I needed only to allow firewall logging using the web interface and then enable remote syslog using SSH to change a configuration file. Packets logged in such a fashion have an input interface name of “wan” and a “DROP” tag.
 Fig. b1 - OpenWRT sample entries.
DD-WRT
DD-WRT logged the firewall packets by default, and I needed only to configure it to output syslog entries to a remote system. The fields of the firewall data were the same. However, I encountered an issue where BusyBox truncated the remote syslog packets to 256 bytes. One can overcome this with further configuration or a switch to another remote syslog package, but as it still provided all information relevant to my analysis, I didn’t pursue this.
Like OpenWRT, all packets from the DD-WRT router have a “DROP” tag. It can be differentiated from OpenWRT by the interface name of “vlan2”.
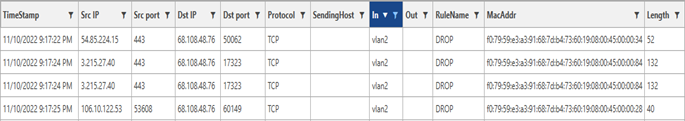 Fig. b2 - DD-WRT sample entries.
Ubuntu Linux
I used Ubuntu Linux 22.04 for this demonstration. I could not procure purpose-designed hardware in time, so I set up a Virtual Machine on my central server, which has a 4-port NIC card. I then set up a WAN/LAN bridge to emulate an edge Linux router for this evaluation. The VM ran on Microsoft Windows 2019 w/Hyper-V.
The Ubuntu Linux firewall logging setup was similar to setting it up with DD-WRT. I enabled the firewall using the ufw command, and it immediately logged to the local syslog. After that, I set up remote logging using a configuration file, which worked well. The only tweak I had to do was add a regular expression to check for the tag, which was “[UFW BLOCK]”. The interface name was “eth0” as I had assigned the first virtual NIC to the WAN port.
 Fig. b3 - Ubuntu Linux UFW sample entries.
Appendix C - Evaluation vs. comparable solutions
During the evaluation, I set an upper bound time limit of 3 hours of configuration effort per product. All of these could eventually work, but three hours seemed sufficient to form a basis of comparison to my solution (which takes around a half hour to set up in total).
Graylog
I have an existing Graylog instance in my environment, which I use for other tasks. When doing my initial research, it seemed Graylog could similarly support firewall data, so I decided to see if it were possible.
The initial setup and configuration of Graylog were done in the past and took approximately 8 hours. At first, I did install the Graylog downloadable virtual appliance but then decided to install the server onto an existing Linux VM. This VM has 2 CPU cores, 8GB of RAM, and approximately 700GB of SSD storage (I use this as a file server as well), 200GB of which is dedicated to Graylog logs.
Unfortunately, I ran into issues similar to Alienvault OSSIM (please see next section). While I was able to set up the firewall as an event source, forward packet data to Graylog, and show the raw data on the screen, this was as far as I could go. While there appears to be support for vendor firewalls in Graylog via third-party dashboards (such as Palo Alto) coupled with Graylog’s paid Enterprise product, Graylog does not have a parser for breaking iptables up.
In conclusion, I couldn’t locate plugins to successfully integrate iptables logs into Graylog beyond simply displaying the raw log output in a dashboard. While this may be possible, the time required to set up Graylog (over 8 hours initially and three additional hours during this evaluation) was already well above the time needed to set up my solution. Thus, we have evaluated Graylog according to the scope of the evaluation framework.
 Fig. c1 - Example Graylog dashboard using Palo Alto.
Splunk
I opted for the 1.4GB Splunk OVA (virtual appliance) to attempt a quick evaluation, which required me to create an account. It’s a virtual machine image designed to drop into an existing VMWare environment quickly. It’s typically pre-configured and runs out of the box without much setup needed.
Immediately I was faced with an issue, the Splunk OVA required 8 CPUs, but my ESXI host only had 4. Despite changing the VM settings to 4 CPU cores, I continued to receive errors regarding a lack of CPU resources and was ultimately unable to get it working. The only host I have with 8 CPU cores is my Hyper-V server. Sadly, this rules out the possibility of using an OVA appliance (there are ways to convert from OVA to a Hyper-V hard disk, but an install from scratch is more sensible as there may be unforeseen consequences of the OVA conversion).
I ultimately installed Splunk on a Hyper-V VM, giving it 4 CPU cores, 128GB of SSD space, and 8GB of RAM.
The setup of the VM and Splunk itself was relatively simple. After this, I redirected the router syslog to UDP port 514 of the Splunk VM and attempted to install the IPTables Netfilter visualization app, its dependencies, the TA_netfilter app, and the Splunk CIM app into Splunk to show a visualization of the firewall data. Unfortunately, the app did not show the initial setup screen when it ran.
I uninstalled the app and made another attempt to install both the IPTables app and TA_netfilter using the GUI tool. After about 45 minutes, I got a dashboard with some basic firewall information, such as packet volume over time, port numbers, etc. However, IP and Geolocation information was still absent, so I also worked on configuring these. I determined the logical Splunk fields were not being parsed and populated correctly (such as clientip, country, city, and so forth), so I worked on this. The issue is rooted in the TA_netfilter dependency.
After much trial-and-error, I could determine that TA_netfilter is not outputting fields into the new event source required by the IPtables Netfilter Splunk app. I spent time reviewing the documentation for both apps. Still, I could not retrieve the relevant fields needed to show geolocation and IP address information as required by the dashboards. At this point, I have hit the 3-hour mark and have at least partial success, so this is a good attempt for this evaluation. I believe it’s possible to get the Geolocation and IP address information correctly in the dashboards, but I could not determine how to do so in the 3-hour window.
Additionally, I ran into frequent warnings about Splunk crossing resource thresholds due to my relatively under-provisioned VM. A recommended Splunk installation has at least 32 CPU cores and 128GB of RAM!
 Fig. c2 - Partial Splunk dashboard achieved in the evaluation.
Alienvault OSSIM
To set up AlienVault OSSIM 5.8.11, I provisioned a VM in line with the recommended requirements: 2 CPU cores, 8GB of RAM, and 128GB of SSD space. I installed it on an ESXi host using a Debian 8 64-bit profile.
During installation, it hung during the step displaying “Configuring alienvault-gvm11-feed (amd64)”. Ultimately I discovered a way to make the installation finish but had I left it alone; it may have ended there. The total installation time from the beginning to the boot logon screen took about 26 minutes.
The initial configuration took around 6 minutes and was straightforward. I had to configure the network interfaces and discovered devices. I determined that my router was not on the list of discovered devices and attempted to add it as an event source.
I reconfigured my router to send UDP syslog packets to the AlienVault OSSIM VM and used the AlienVault OSSIM troubleshooting tools (netstat and syslog) to confirm Alienvault’s VM was receiving the packets. However, they would not show up in the web interface. I spent about two more hours researching to figure out a way to incorporate these packets into the UI but was unsuccessful.
Additionally, I looked into the various dashboards available and tried to find something that showed the Geolocation or port information for firewall packets. Built-in dashboards only show generic information such as authentication, authorization, etc. While this additional insight may be available, I could not find it during the evaluation.
Hence, AlienVault OSSIM may be a viable all-purpose solution for many threats, but it does not have specific firewall insight capabilities. I suspect that doing so would require significant customization, possibly setting up an unsupported configuration. However, I am not an expert in AlienVault OSSIM, so I might have missed something.
Time spent for this evaluation: Approximately 3 hours. Result: Inconclusive, but likely not supported.
IPFire
I will briefly mention IPFire because it contains similar features and can act as an IPS. However, because of the hardware requirements, IPFire is not a direct competitor in this evaluation. I fully endorse IPFire as an alternative solution to my project, provided the reader has adequate physical equipment.